The Best Jobs for 2011
In USA ok..not Malaysia..
1. Software Engineer
 Chip Chipman/Bloomberg via Getty Images |
Researches, designs, develops and maintains software systems along with hardware development for medical, scientific and industrial purposes.
Overall Score: 60
Work Environment: 150
Physical Demands: 5
Stress: 10.4
Median Income: $87,140
Hiring Outlook: 27.4
2. Mathematician
 PhotoAlto/Michele Constantini/Getty Images |
Applies mathematical theories and formulas to teach or solve problems in a business, educational or industrial environment.
Overall Score: 73
Work Environment: 89.72
Physical Demands: 3.97
Stress: 12.78
Median Income: $94,178
Hiring Outlook: 19.78
3. Actuary
 AP Photo/John Bazemore |
Interprets statistics to determine the probabilities of accidents, sickness, death and loss of property from theft and natural disasters.
Overall Score: 123
Work Environment: 179.44
Physical Demands: 3.97
Stress: 16.04
Median Income: $87,204
Hiring Outlook: 17.04
4. Statistician
 George Pchemyan/istockphoto |
Tabulates, analyzes and interprets the numeric results of experiments and surveys.
Overall Score: 129
Work Environment: 89.52
Physical Demands: 3.95
Stress: 14.08
Median Income: $73,208
Hiring Outlook: 11.08
5. Computer Systems Analyst
 Dan Driedger/istockphoto |
Plans and develops computer systems for businesses and scientific institutions.
Overall Score: 147
Work Environment: 90.78
Physical Demands: 5.08
Stress: 16.53
Median Income: $77,153
Hiring Outlook: 15.53
Click here to see the full list of the Best Jobs for 2011
The Worst Jobs for 2011
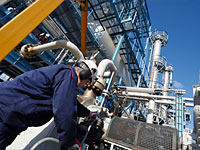
1. Roustabout
 Christian Lagereek/istockphoto |
Performs routine physical labor and maintenance on oil rigs and pipelines, both onshore and off.
Overall Score: 892
Work Environment: 892
Physical Demands: 36.89
Stress: 26.43
Median Income: $32,143
Hiring Outlook: -19.57
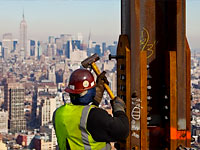
2. Ironworker
 AP Photo/Mark Lennihan |
Raises the steel framework of buildings, bridges and other structures.
Overall Score: 887
Work Environment: 1,593.72
Physical Demands: 36.85
Stress: 31.270
Median Income: $34,127
Hiring Outlook: -12.73
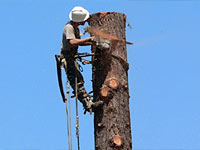
3. Lumberjack
 Jeffrey Hochstrasser/istockphoto |
Fells, cuts and transports timber to be processed into lumber, paper and other wood products.
Overall Score: 868
Work Environment: 1817.53
Physical Demands: 38.87
Stress: 40.09
Median Income: $32,109
Hiring Outlook: 0.09
4. Roofer
 Ju-Lee/istockphoto |
Installs roofs on new buildings, performs repairs on old roofs and re-roofs old buildings.
Overall Score: 863
Work Environment: 1,481.2
Physical Demands: 33.46
Stress: 30.68
Median Income: $34,168
Hiring Outlook: -9.32
5. Taxi Driver
 Rafael Ben-Ari/Chameleons Eye/Newscom |
Operates a taxicab over the streets and roads of a municipality, picking up and dropping off passengers upon request.
Overall Score: 821
Work Environment: 2,317.21
Physical Demands: 14.46
Stress: 46.27
Median Income: $21,127
Hiring Outlook: 5.27
Click here to see the full list of the Worst Jobs for 2011


0 comments:
Post a Comment